Copyright notice: All the
animations on this page are property of Frédéric Masset.
They may be used freely
for non-profit purposes (e.g.
scientific talks), provided appropriate credit is given. For any other
use, permission
must be obtained from me.
![]()
 [Enlarge]
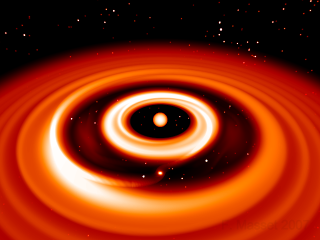
This animation shows a
virtual fly-by in the vicinity of a Jupiter-sized forming giant planet.
The simulation has been performed using the JUPITER code, with 7 levels
of refinement. The background stars are fictitious, and are added to
get a better feeling of the observer's motion. Clicking on the image
above will download a 16 Mb high quality AVI DivX file.
Please click here to download the
animation in Quicktime format (17 Mb).
 [Enlarge]
This MPEG shows the appearance of the spiral wake over 4 orbits in the inertial frame. The perturber (a point-like planet) is turned on at t=0 in the disk, without any tapering.
 [Enlarge]
This MPEG shows the Type I migration of an embedded protoplanet, in the corotating frame, over 200 orbits. The dashed circle represents the initial orbit. The disk aspect ratio is 4%, the planet mass is 40 earth masses (i.e. above the critical mass for rapid gas accretion), but accretion is turned off and the viscosity is set to a high value in order to prevent the depletion of a gap or dip around the orbit. The disk surface density scales as r^{-3/2}, and the color scale represents the perturbed surface density divided by the (unperturbed) initial one. One can notice the slight depletion of the coorbital zone at the end of the animation.
 [Enlarge]
Same as previous MPEG, except that this one shows half of the disk and shows the "migration curves", i.e. the primary to protoplanet distance as a function of time. One can notice that this curve is almost straight, as one expects from the torque scaling in a "\Sigma\propto r^{-3/2}" disk with uniform aspect ratio.
 [Enlarge]
This MPEG shows the Type I (without gap) to Type II (with gap) transition. The slowing down in the Type II regime is very apparent. Accretion is switched on suddenly at t=100 orbits. The accretion rate is set to a high value to allow a rapid growth of the planet mass, which reaches 2 Jupiter masses at the end of the animation. The accretion rate is so high that the circumplanetary disk "starves" and cannot be seen at the end of the animation. One can notice that the spiral wake is much more contrasted at the end.
 [Enlarge]
Same as previous MPEG, except that this one shows half of the disk and shows the "migration curves", i.e. the primary to protoplanet distance as a function of time. The slowing down when entering the Type II regime is very apparent.
 [Enlarge]
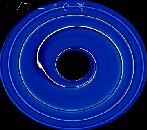
This MPEG shows the disk response to an embedded non accreting planet with one Jupiter mass, held on a fixed circular orbit over 100 orbits. One can notice that this is typically the time needed to open a gap.
 [Enlarge]
This MPEG shows the runaway migration (also often referred to as type III migration) of a Saturn sized protoplanet embedded in a massive disk. The asymmetric depletion of the horseshoe region is very apparent (see Masset and Papaloizou, 2003) The planet rushes toward the central object in a few tens of orbits.
 [Enlarge]
This animation refers to
the same calculation as the previous animation. It shows
the behavior of a passive scalar (that is initially a function of r
only).
This passive scalar can be thought of as a label transported by the
fluid elements.
One can see the light blue region that migrates together with the
planet. It corresponds
to fluid elements trapped in the horseshoe region of the planet. It
adopts the
"tadpole" shape characteristic of the regime of fast migration
(see also Masset and Papaloizou, 2003)
I sometimes use the
following animations in talks on disk-planet interactions. They
illustrate a few aspects of these interactions.
The above MPEG shows the
wake triggered by a small mass planet in a disk after 100 orbits. Each
frame represents the end result of a different run, with a disk aspect
ratio H/R increasing from 4%
to 9%. The spiral wake gets more and more open as the disk thickness
increases, and at the same time its amplitude decreases (the color
scaling is the same for all frames).
The above MPEG shows the
disk response in the phi-r
plane, as a function of the planet mass. Each frame represents the end
result of a simulation over 100 orbits. The planet mass follows a
geometric sequence over the frames, starting from 10-3 earth masses (the 0.00 label of
the first frame is a round-off error) to about 1500 earth masses (5
Jupiter masses). The color scaling is adapted to the planet mass. As
long as the planet mass is small (smaller than a few earth masses), the
disk response is linear and all frames are alike. The wake shape than
begins to be significantly modified for larger masses, and a gap is
opened around ~100 earth masses. This gaps gets deeper and wider as the
planet mass increases. For very large
planet masses, the flow is no steady state in the planet frame. One may
notice small "ripples" downstream the wake for low planet masses. They
are a resolution issue, as they tend to vanish for larger resolutions.
They are likely associated with high-m
wake components, since they disappear when the planet begins to
open a gap.
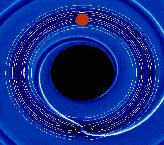
The above animation shows
a fixed frame representing the surface density of a disk perturbed by a
Saturn mass planet and a few streamlines in the rotating frame. In
addition, it shows the libration motion of a fluid element represented
by the orange full circle. This fluid element follows a horseshoe
streamline, and corotates, on the average, with the planet.

![[Enlarge]](movies/incrthick.jpg)
![[Enlarge]](movies/incrmass.jpg)
![[Enlarge]](movies/libhs.jpg)